Resources
- Burrow – Nest Client (pypi)
- apcupsd – Windows/Linux daemon for monitoring APC UPS
- statsd-home – Collection of scripts for sending data to statsd
- Docker-Graphite-Statsd – Docker image for Graphite and statsd
- Pyrite – Simple Python app for yaml generated dashboard
The Details
I am a self-proclaimed stats and graphs nerd. Ever since I’d been introduced to monitoring at work, graphs, stats and dashboards have interested me. With so many devices in my home being connected to the net, I didn’t need much excuse to geek out and put together a dashboard for my home. I’ll jump in by describing the devices I’ve begun monitoring.
Nest
The obvious first choices were my two Nest Thermostats. These collect stats like current temperature and current humidity, along with the target temperatures and humidity. They also report what pieces of the system are active. In order to get at this data, I had a few options. The first option was Nest’s recently published developer API. This API uses oAuth, which allows services to easily request access to and control multiple accounts. The other option was using Nest undocumented mobile API. Auth is provided through user/password login, followed by an access token. I decided to go with the mobile API because I didn’t need all of the advanced features oAuth provides, just to collect stats on my own Nests.
My language of choice has been Python, and there are a few Python libraries for interacting with the mobile API. Initially, I used pynest but found that constantly making calls with it ended up invalidating my web sessions. This was because each call would re-login, and with a call happening every 5 minutes, my web sessions would get invalidated every day. Because of this, I decided to write a client that used a config file to not only store username and password, but also store the access token and expiry date. Burrow, as I call it, is a very simple client. It makes one call to get system stats, and returns the result as json.
UPS
The other devices I decided to monitor were my UPSes. I currently have two CyberPower and one APC units. CyberPower publishes a linux CLI client and it works fairly well. My APC UPS, on the other hand, is attached to my Windows desktop, and their Windows client is not very CLI friendly. Luckily, a third party publishes a daemon and cli client for monitoring APC UPSes: apcupsd. Right now, I only have one of the two CyperPower units monitored. The smaller unit is powering my R6300 router, and I’m waiting until I can get a small device like a Raspberry PI or Intel’s Galileo, it’s going to stay unmonitored.
Collecting these stats is fairly simple, I’ve registered multiple scripts in cron that run every minute. Output from the above tools is parsed and pushed to a service called statsd. I’ve published these scripts here: statsd-home. UPS stats are parsed via simple Regex, which can be a bit messy in my opinion. My Nest client provides json output, so parsing is a bit cleaner.
Graphite
When it comes to stats aggregation and graphing, my choice
was Graphite
with statsd. Statsd provides simple wrappers and abstractions
around the sending of raw data to graphite. All of my stats
are simple gauges. Installing Graphite can be a little tricky
as there are many parts to it, but I opted to use
Docker and the Docker-Graphite-Statsd
image. Docker provides a repository of pre-built images and
orchestration for running those images within Linux Containers.
Installation is as simple as docker pull hopsoft/graphite-statsd.
Running is a bit more complex, especially if you are trying to
run a container on boot, but the
Docker-Graphite-Statsd README
provides details on running the container.
Last comes actually generating the graphs and displaying them publicly. Graphite’s web interface is fairly full featured for building and testing new graph ideas, but I didn’t want to actually expose my graphite server. Originally, I had setup a cron job to periodically download the graphs to the web root, and some static html. But, not only was it becoming a pain to add more graphs, but it also didn’t allow dynamically setting the date range or colors.
Pyrite
So, I wrote a simple flask app that generates pages from a yaml config file. I’ve published that as well: pyrite. My config can be found here. Yaml is pretty powerful and by using a simple config file, I don’t need to set up something like a database. The config contains graphs, which are made up of targets (individual sets of data to graph), and properties for those graphs. Pages are also included in the config, they are made up of rows containing graphs. Ultimately, when images are requested, pyrite itself queries graphite and streams the image back to the user.
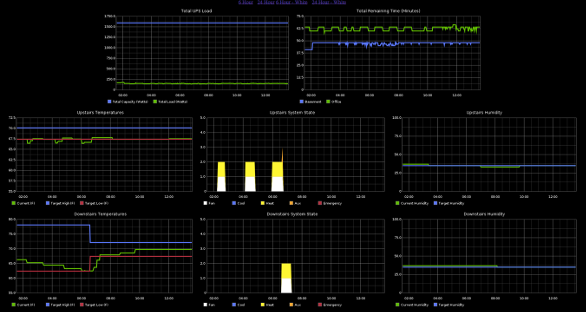
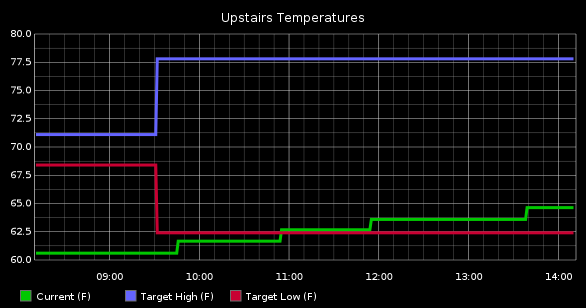
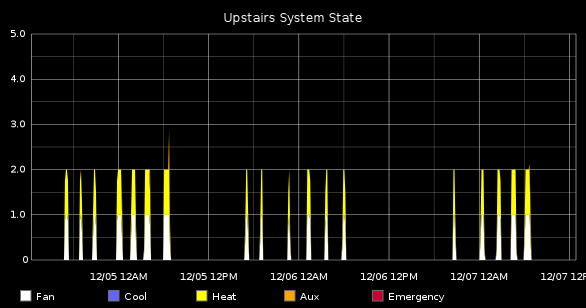
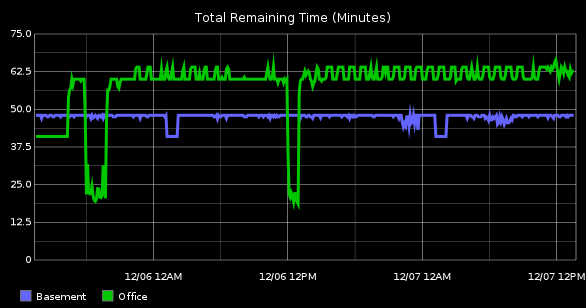
So, the moment you’ve been waiting for. My Home Dashboard can be found here: home.apmelton.com. The layout is dynamic, but it looks best at, or above, 1080p. The first two graphs are a combination of stats from my two UPSes. The next graph is current temperatures from my upstairs thermostat, blue line represents the temp cooling will kick in, red line represents temp heating will kick in, and green line is current temp. Following that graph is the upstairs system state.
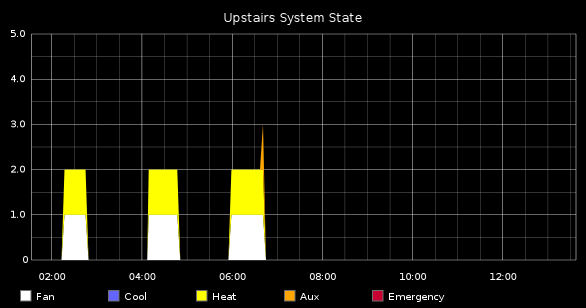
Each colored increment represents a different function that’s running. In the above example, you can see at 6:00am the fan and heat turned on, and at the very end aux heat clicked on as Nest didn’t think it was heating up fast enough.
The next graph contains current and target humidity. For my house, this is mostly just informational as I don’t have a (de)humidifier in my system. The next three graphs are identical to the previous three, but for the downstairs thermostat. Lastly, the bottom 4 graphs are individual UPS details broken down further from the first two.
TODO
Lastly, I’d like to touch a little on what’s still left to add and improve:
- Pyrite
- Actually templatize pyrite with something like Jinja2
- Add drop downs for date range instead of hard-coded links
- Add dynamic links for colors instead of hard-coded links
- Statsd-home
- Investigate SNMP from dd-wrt routers, I’m hoping for stats like connected wifi clients, active dhcp sessions, bandwidth usage, etc…
- Other
- Microcontroller device for monitoring other Cyperpower UPS